Marc Walton on May 22, 2013
 Hi,
some of the newer members and long term member Martin have asked me to
make a video explaining the Head & Shoulders pattern. I have also
added some notes (video to follow) on triangle break outs of which there
are many brewing at the moment. My short at 0.8500 on the Euro/Gbp
failed yesterday BUT there is now a possible 500 pip move on this pair!
Hi,
some of the newer members and long term member Martin have asked me to
make a video explaining the Head & Shoulders pattern. I have also
added some notes (video to follow) on triangle break outs of which there
are many brewing at the moment. My short at 0.8500 on the Euro/Gbp
failed yesterday BUT there is now a possible 500 pip move on this pair!All of these types of technical moves are based around the M2 strategy of a break out followed by a pullback. Breaks of major trend lines are highly significant, as traders all over the world will see them. In February I showed how we used the break of the Gbp/$ trend line to jump in to trades that eventually went 800 pips. If you want to trade longer time frames and by definition spend less time sat in front of your charts, then being able to spot these moves as they develop is crucial. You also need buckets full of patience and discipline. The Euro/$ for example has bounced away from the neck line for now at least BUT it is still THE area that we do not want to miss.
In the video I explain the theory of a Head & Shoulders break out on the Euro/$ which could give us a 750 pip move back down around $1.200 as per Sundays video analysis.
http://youtu.be/2DU2g8z51z8
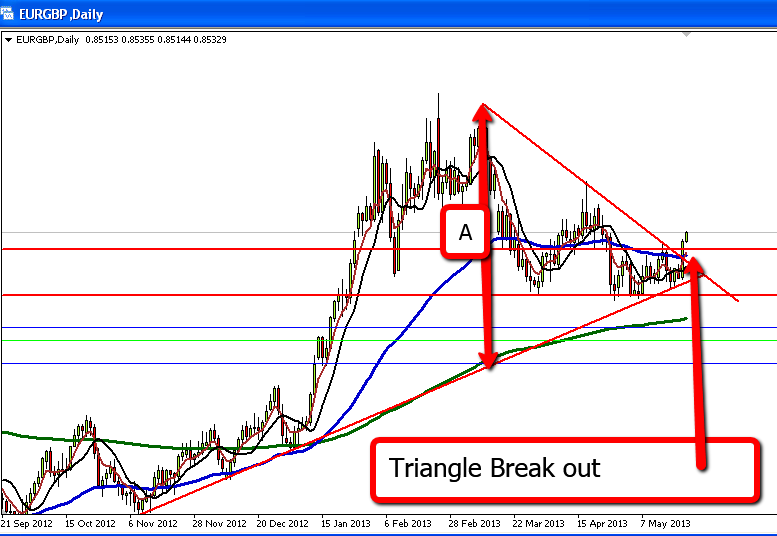
Triangle Break Outs
I will make a video on this subject at a later date, but its a fairly simple concept that you can see in the diagram below. Thanks to member Chris for pointing out how big this triangle is on a daily Euro/Gbp chart.
Simply measure the top to the bottom of the triangle (point A). The size of this gap, approximately 500 pips on this pair, should be reflected in an equal move once price breaks out. That would take us to around 0.9100 on this pair (though 0.9000 will be very hard to break). As price gets nearer to the point of a triangle, the more significant the pattern becomes. Price becomes almost like a coiled spring waiting to burst free. The nearer that price gets to the point usually the more dramatic the break out. It might of course fizzle out and simply drift sideways BUT 0.8500 has also been major previous resistance and therefore I am hopeful that this is going to be a major move.
I have taken the trade at 0.8520 as that was previous resistance and where I have had my stop for shorts in recent weeks. Other than that I continue to look for trades as per Sundays detailed analysis. Have a good one. Marc